Housing fingerprint visualizer

SOLUTIONS

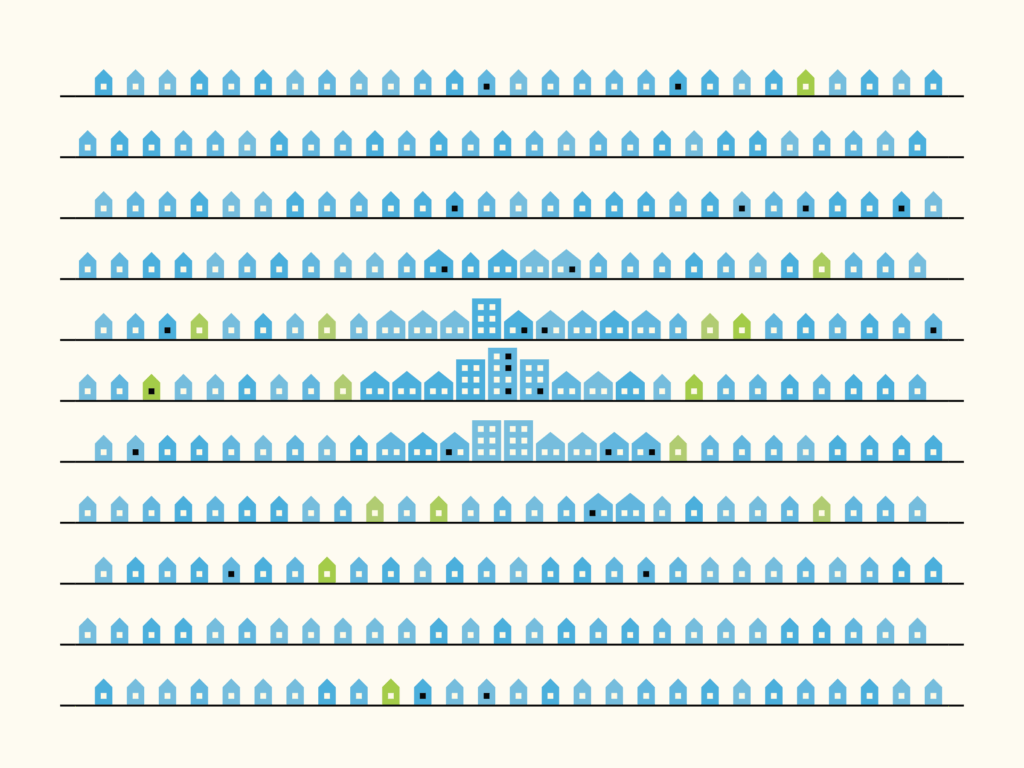
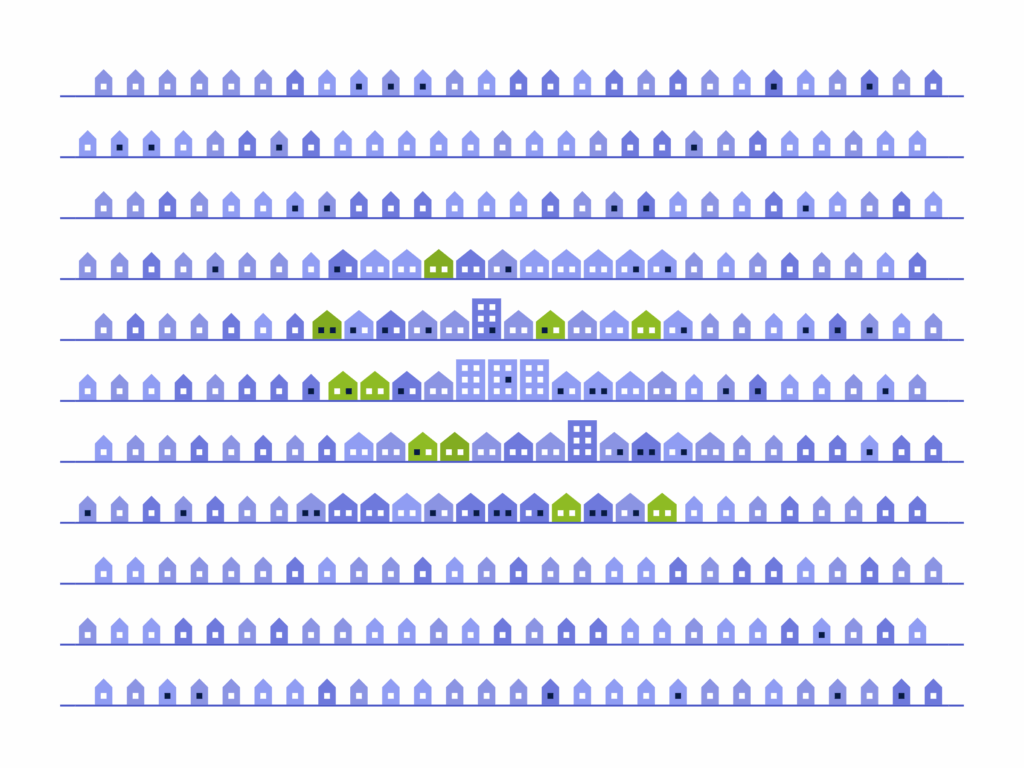
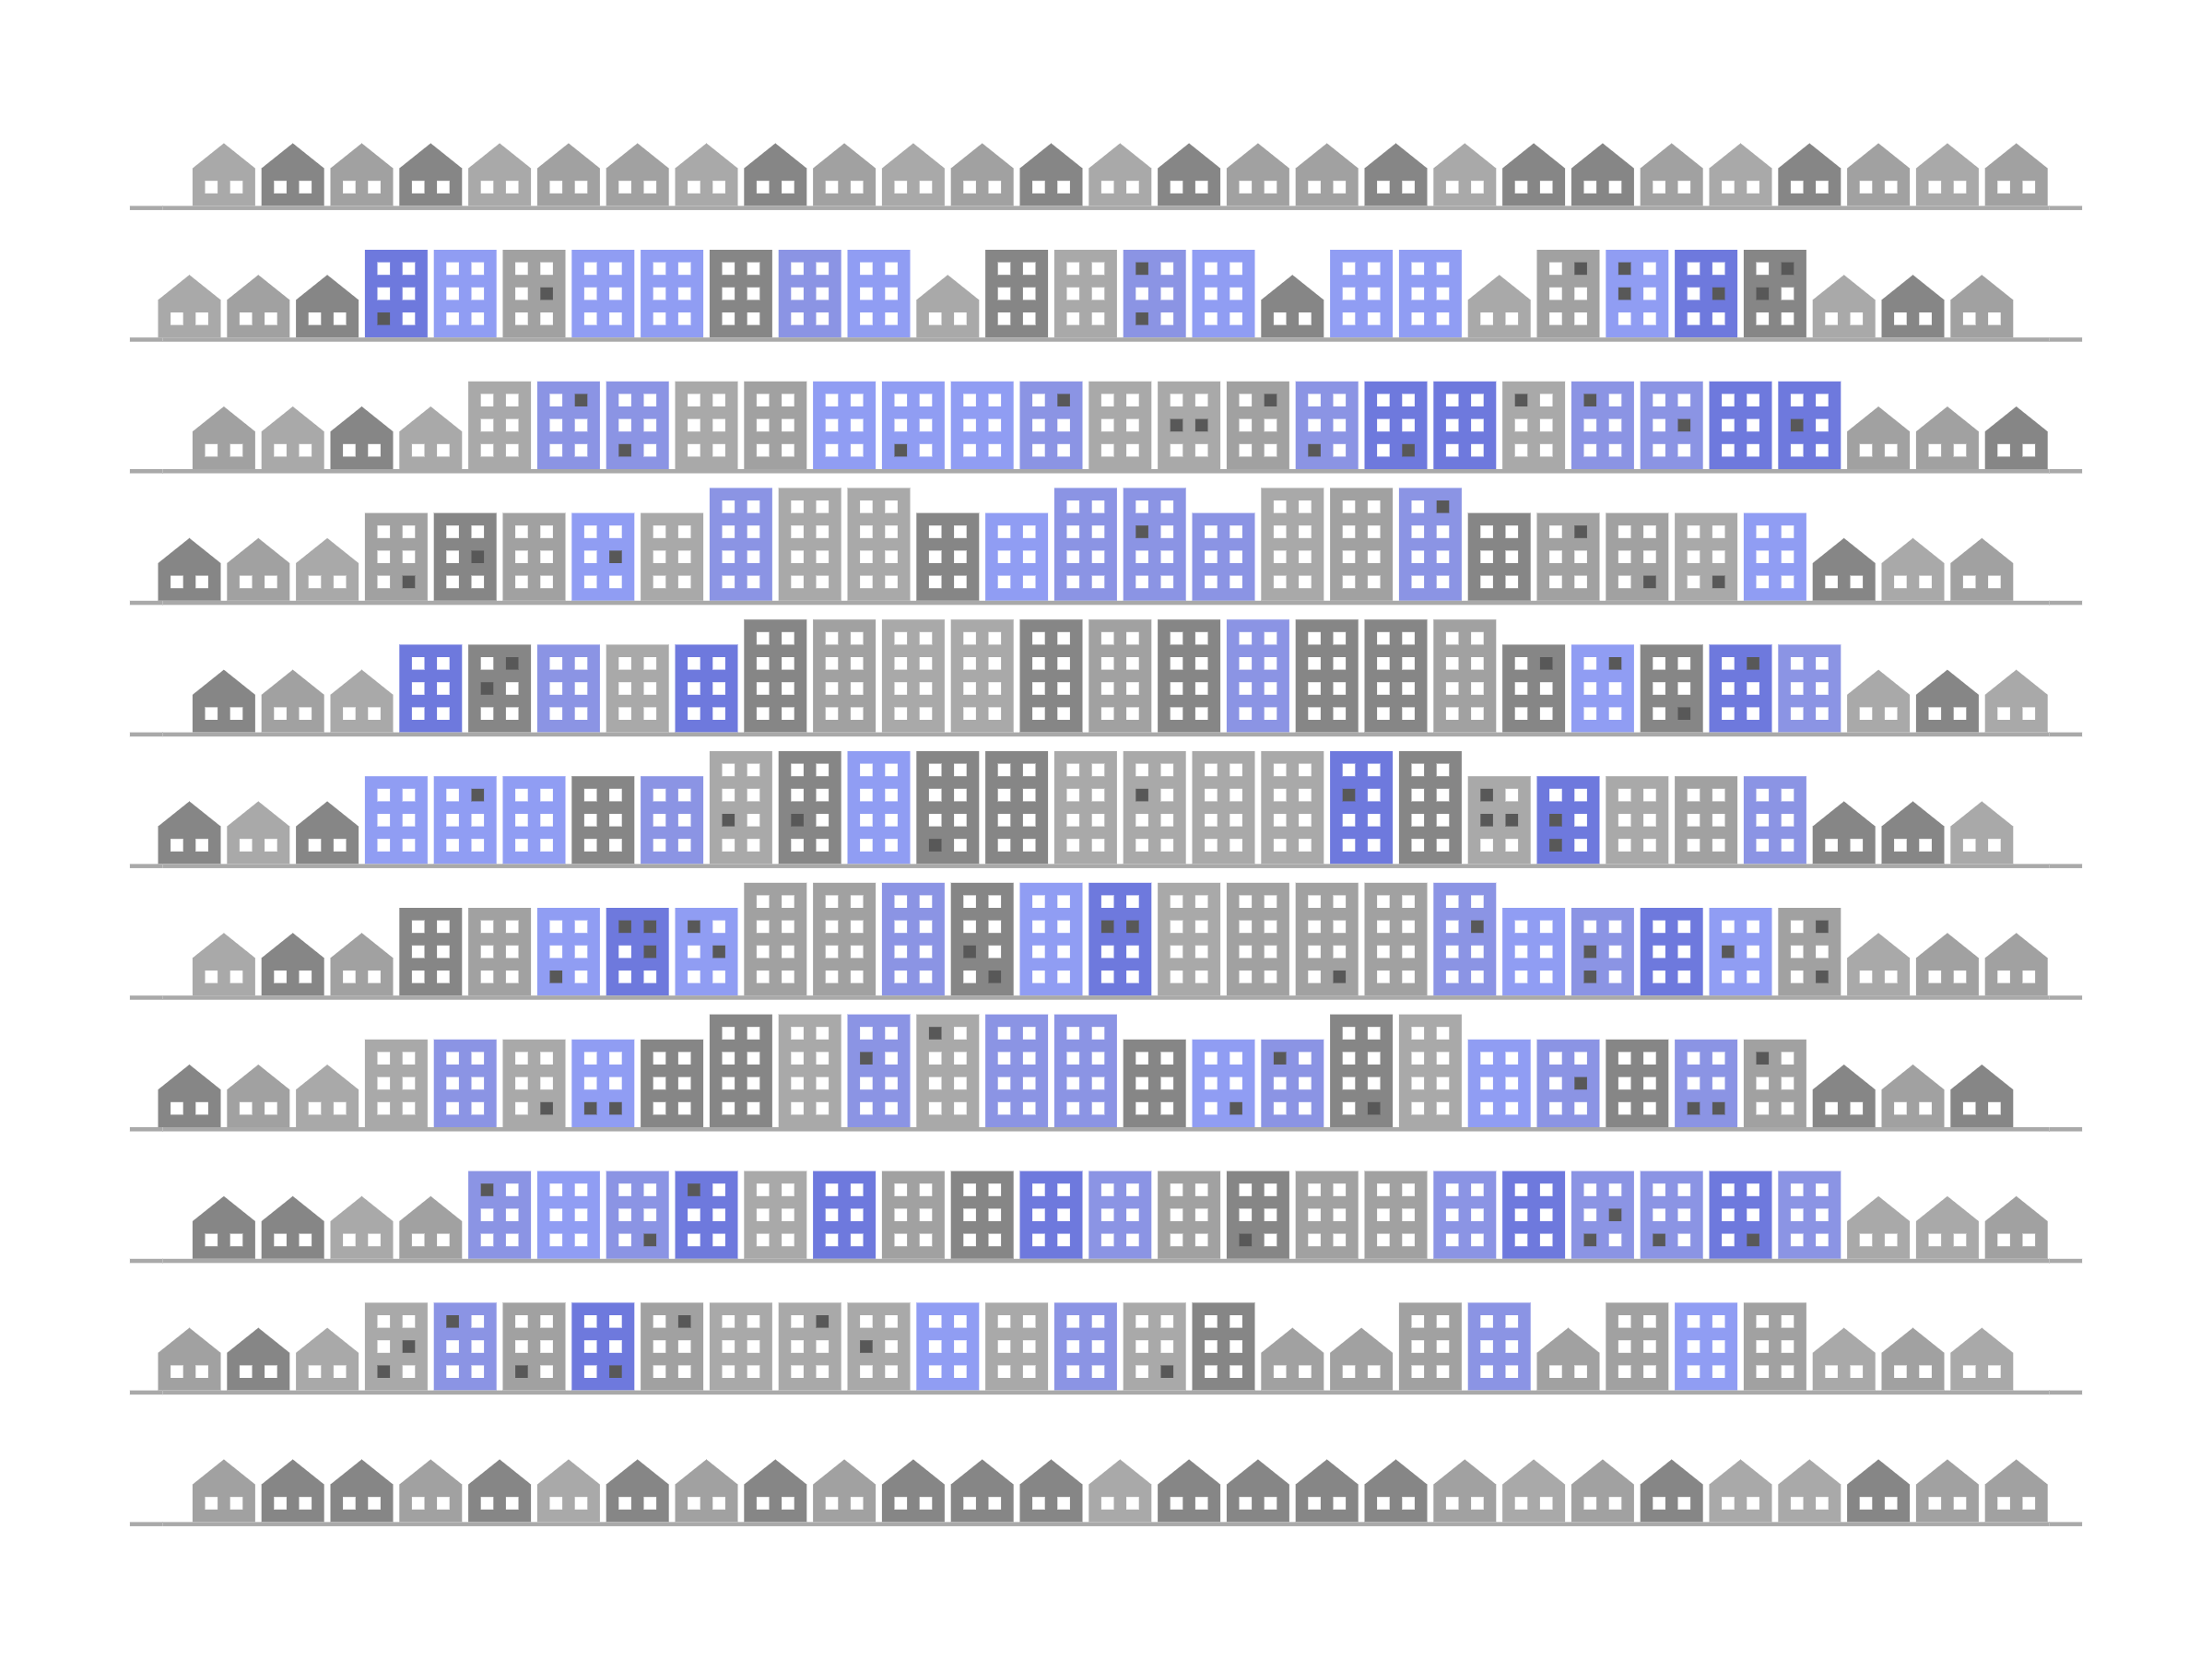
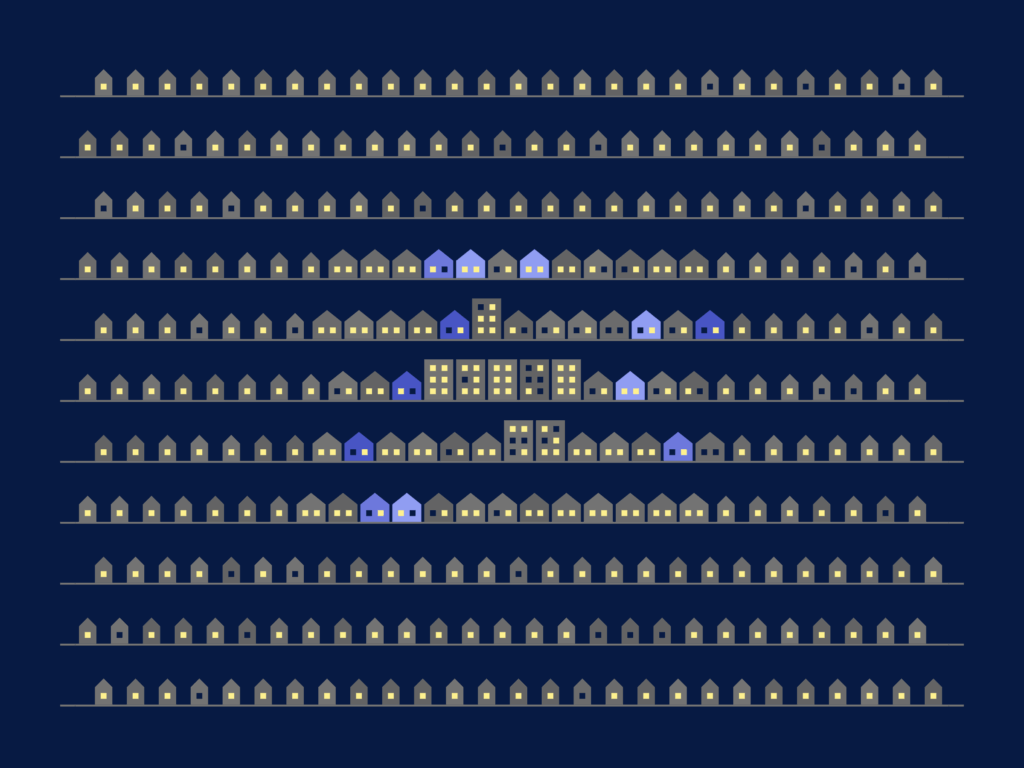
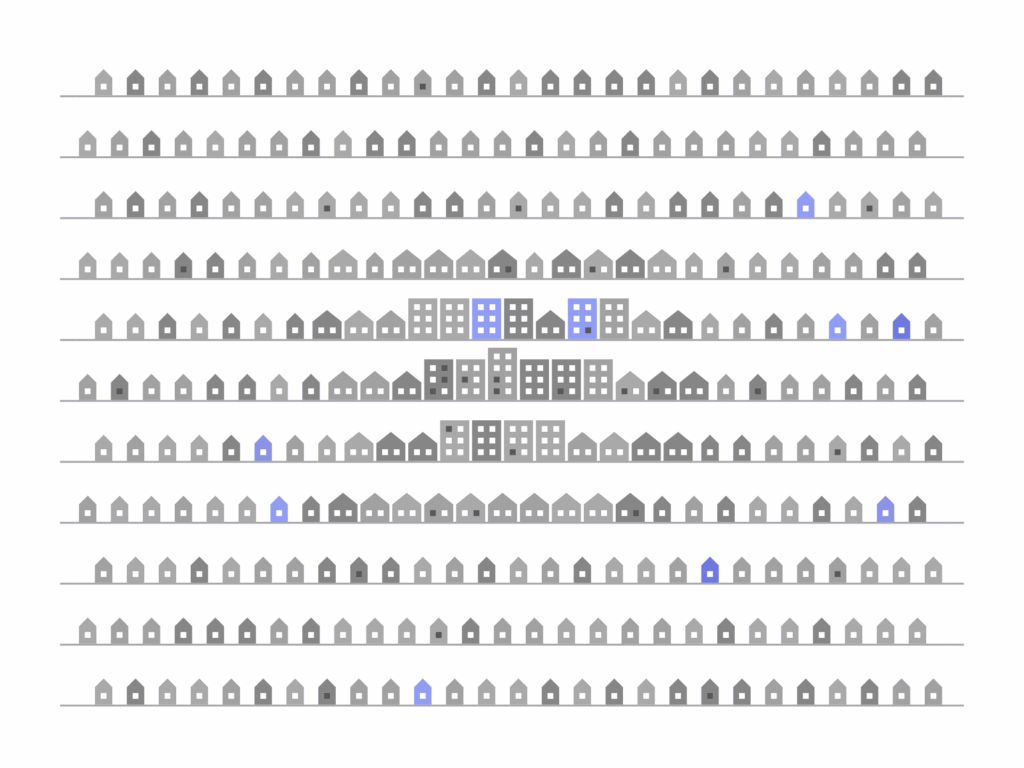
CommunityScale collaborated with artist Roni Kaufman, who used code to visualize housing data in a new way. The work explores three key metrics for a community: the relative share of housing by structure type, the share of structures built since 2015, and the vacancy rate. Together they form a distinctive fingerprint of each place. Because the images are generated with p5.js on every run, each one is unique, and the colors can be customized for individual clients and communities.

We collaborated with artist Roni Kaufman, who used code to visualize our housing data. The work explores three key metrics: the relative share of housing by structure type, the share of structures built since 2015, and vacancy rates.

The result is a fingerprint of that community’s housing. Because the images are generated by p5.js on each run, every image is unique and we are able to customize the colors for clients.