CommunityScale completed a housing study for Intend Indiana covering the Indy East Economic Mobility District, also known as the Eastside Promise Zone in Indianapolis. Intend Indiana is a NeighborWorks America chartered nonprofit that runs affordable homeownership development, two certified CDFI lending funds, and a land bank for vacant and abandoned property. The study was built to ground conversations with partners about where new housing programs should focus, and to serve as the data foundation for later phases of work.
The district is home to 41,111 people in 18,142 households, with a median income of $51,215 and a slight renter majority at 53%. Households earning 80% of the metro’s area median income (AMI) can afford the median home both in the district and citywide. Households at the district’s own median income can afford the district median, but not the citywide median without becoming cost burdened. That gap is the study’s central tension: the neighborhood is still reachable, and the city around it is becoming less so.
Rising incomes, unevenly
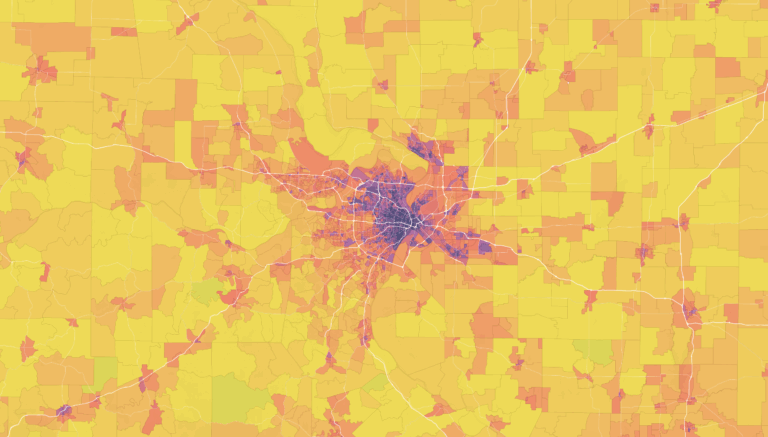
Incomes in the district are rising and projected to keep rising, with the fastest growth at the top. Households above 120% AMI are projected to grow 16% by 2035 versus 7.9% for households below 30% AMI. Geographically, the growth is concentrated in the northwest and north-central portions of the district, while the south side has seen slow or negative income growth. Most of the growth at the highest income level is among white households; elsewhere in the distribution, growth is mostly among Black households and households of other races.
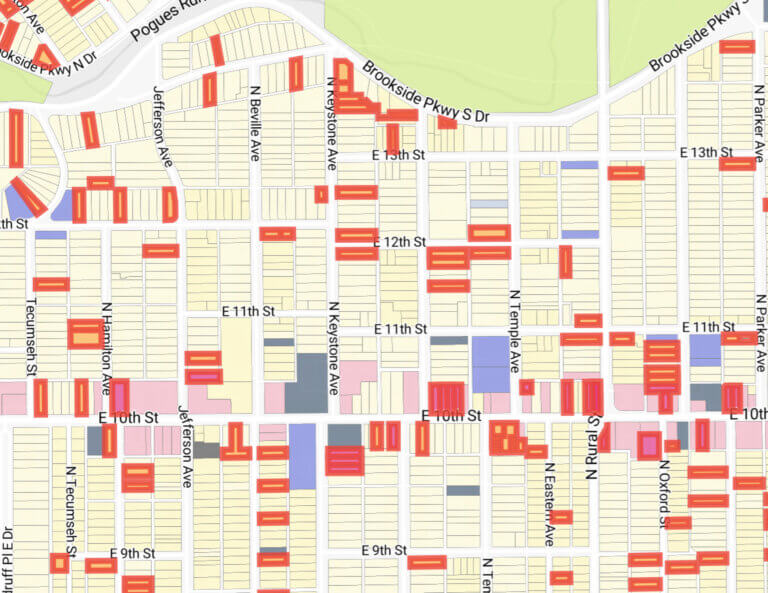
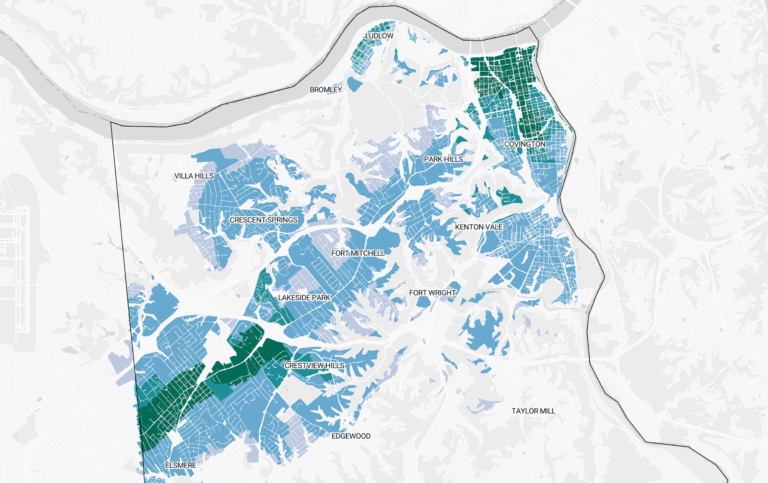
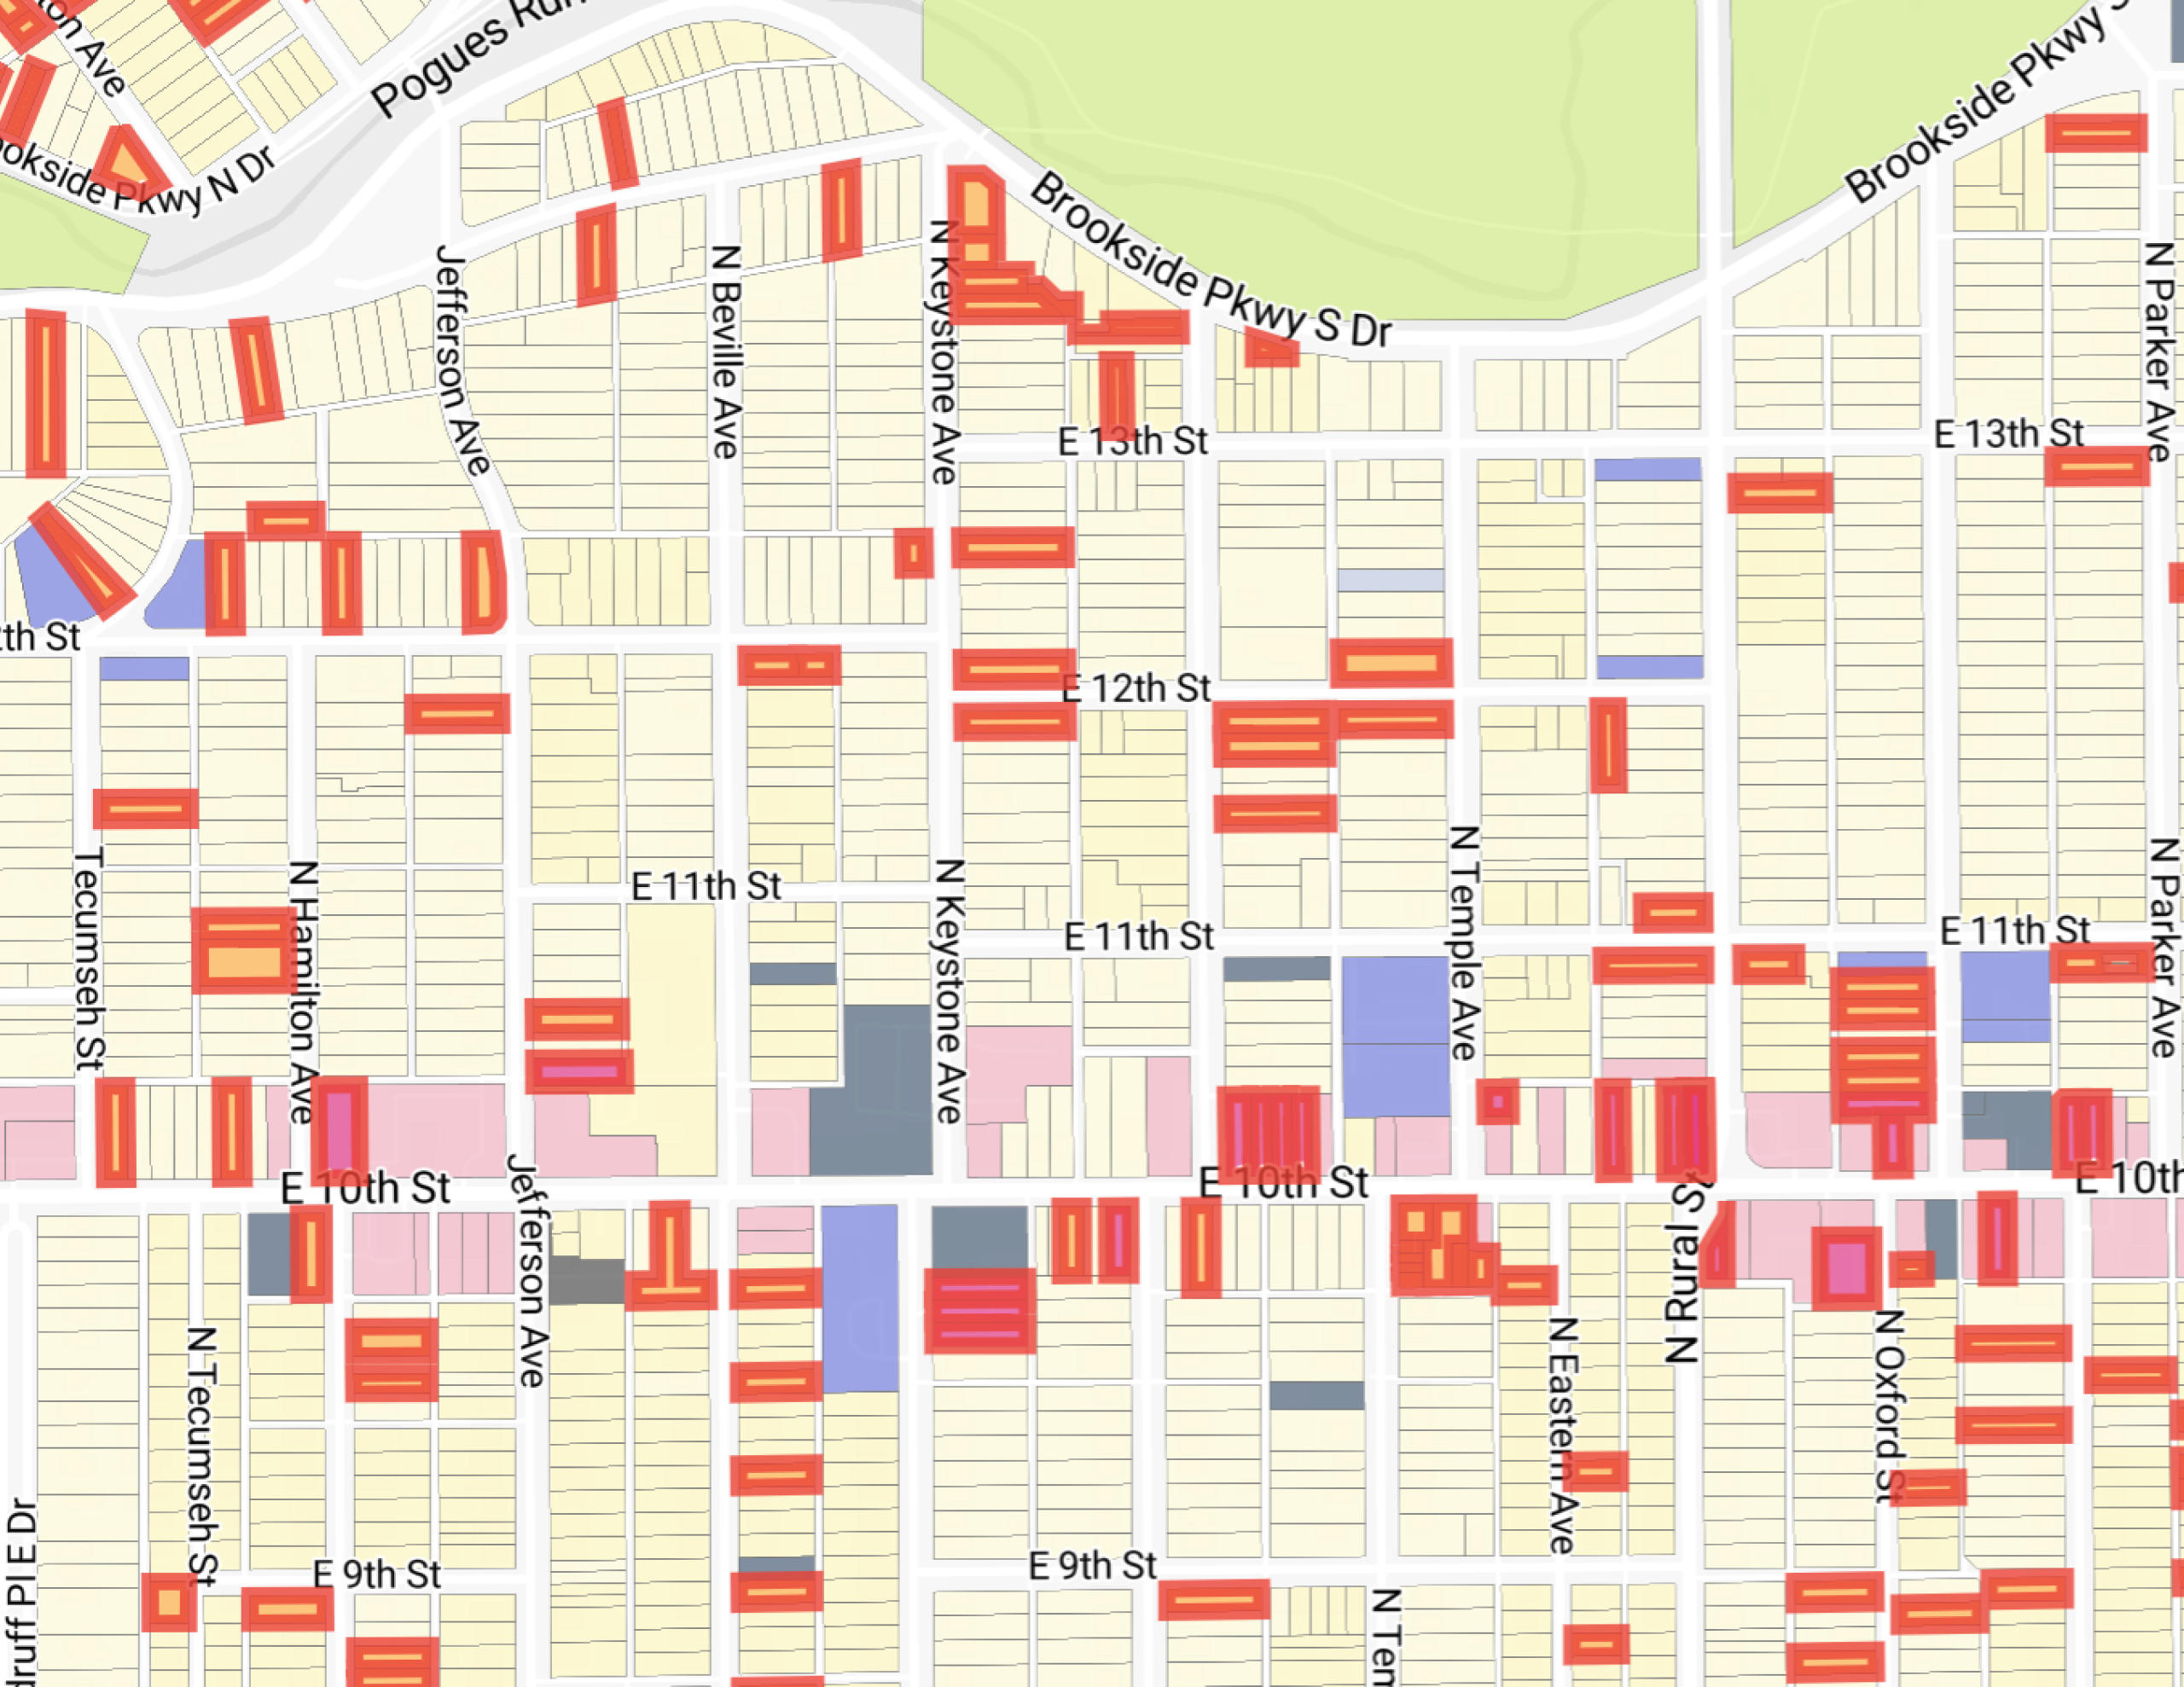
To illustrate the geographic differences within the district, we developed parcel-level displacement risk indices that combine low property values with high concentrations of long-tenured non-white households, and a parallel index for low-income seniors. Both are mapped so partners can see block by block where market pressure is most likely to displace existing residents.
Senior homeowners in aging housing
Seniors emerged as the most specific vulnerability in the district. Owners of 343 residential parcels claimed the Over 65 property tax credit against their 2024 bill. Of those, 140 derive 10% or more of their assessed value from land alone, an indicator of homes that may be deteriorating and in need of reinvestment. Median assessed value for senior-owned parcels was $99,700, against $145,000 for all owner-occupied parcels in the district. Nearly all of these homes predate 1950.
There is also very few small ownership options in the district, almost nothing at zero or one bedroom. While this may be in line with historic development patterns, the lack of small units presents an obstacle for a senior homeowner who wants to downsize and stay in the neighborhood.
What it takes to keep up
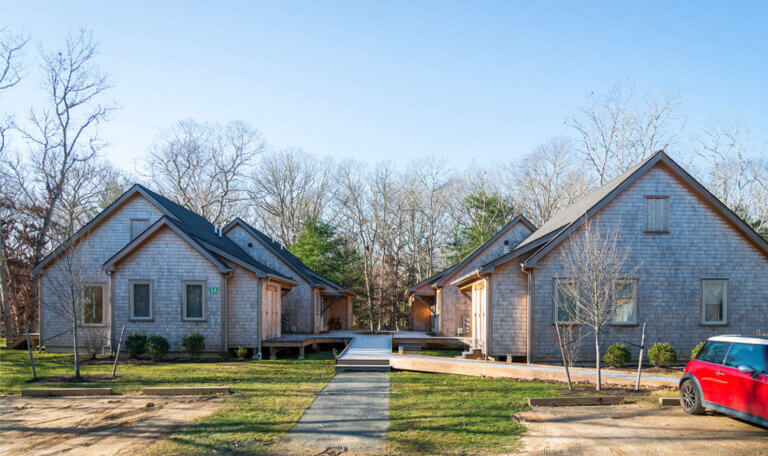
More than half the district’s housing was built before 1940, which may increase deferred maintenance costs and risks on residents of any tenure over time. In the past decade, over 1,200 multifamily units have been built. About two-thirds of recent multifamily construction is in fully or partially income-restricted developments.
The district is projected to add about 1,930 households over the next ten years. With adjustments for stock replacement, rental vacancy, and a substandard-housing rate above the national average, the ten-year production target comes to 2,581 units, or about 258 per year and 1.3% annual growth.
Every map supporting this analysis is published as an interactive layer, covering median household income and its change over the past decade, cost burden for renters and owners, household growth, land use and land value share by parcel, displacement risk for seniors and for ethnic minorities, and property tax exemptions by parcel. Explore it at communityscale.github.io/Eastside.