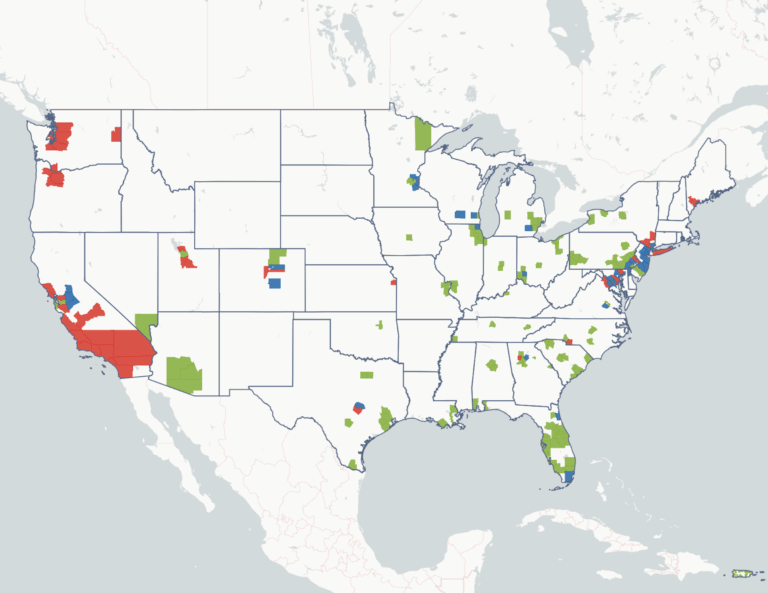
Federal, state, regional, and local governments compute housing need estimates across their jurisdictions and within individual communities. In some places, these estimates are used to set goals, like Massachusetts’ Future Housing Demand, which provides future housing need scenarios to support state and regional planning and production targets. In others, these estimates are regulatory, like California’s Regional Housing Needs Allocation, which assigns each city a binding number of units it must plan and zone for. Housing production need estimates are also a common feature of planning studies (our Housing Forecast includes a housing production need for every community in the country.)
Comparing different housing needs estimates can show very different numbers for the same community or region, varying by hundreds or even thousands of units. In 2024, Brookings catalogued six approaches to estimate the national housing shortage that were millions of units apart.
There is no one right way to estimate housing needs and every methodology is based on a set of choices that influence the final result. This post walks through the types of housing needs estimates and the methodology choices that lead to such wide-ranging results.
The building blocks of a housing need estimate
The broad concept of most housing need estimates is the same:

These broad categories map onto more specific ideas that researchers use to understand the different components of a housing market.
- Today’s unmet demand: household growth, existing deficit, missing households, cost burden, overcrowding, substandard housing, homelessness
- Future demand: household growth, replacement
- Market-function allowance: vacancy allowance, second / seasonal homes
- Existing supply: turnover credit, existing stock
Methodologies differ in the details of each part of the calculation.

The following chart summarizes how different housing need estimate methodologies (Harvard’s Joint Center for Housing Studies, California’s Regional Housing Needs Allocation, and Massachusetts’ Future Housing Demand) use different combinations of these building blocks to determine their results. In MA, the turnover credit is an adjustment to the total need estimate.

Top down or bottom up?
Housing need estimates also differ in how housing need is estimated across space: a regional total can be allocated down to localities, or local estimates can be summed up to a regional number. A top-down method computes one regional number and divides it among localities by formula. The allocation formula, whether based on transit access, job proximity, income capacity, developable land, or fair-housing goals, decides which towns owe the homes. A top-down allocation encourages the state or region to focus housing production needs on places that have historically limited housing, which is the point of fair-share systems. This allocation does not always match public expectations; for example, wealthy communities that have very few cost-burdened households because they are already very expensive may appear to have “less need” compared to other parts of the region.
A bottom-up method starts with individual, local assessments and aggregates them up to the regional level. Bottom-up estimates assign housing needs to the jurisdictions where it is measured, but fail to capture larger, regional housing market dynamics.
Do you count the hole you’re already in?
Low vacancy rates, high cost-burden rates, and other housing market indicators can be used to estimate the pent-up demand for housing, or demand for housing that doesn’t yet exist. Researchers do not agree whether and how this existing pent-up demand should be factored into the estimation for future housing needs because measuring pent-up demand relies on modeling assumptions; ultimately, it it is not clear where the line is between housing “need” and a general “desire” to live in a certain type of unit or in a certain place.
- Governing programs usually include it. California, Oregon, Washington, New Jersey, and Massachusetts all include existing need for housing into the total. Existing need can dominate the result.
- Harvard’s Joint Center for Housing Studies provides an analytical counterpoint. JCHS projects new-unit demand as household growth plus replacement, second homes, and normal vacancy, and deliberately excludes the accumulated deficit. Its projection is a baseline for future demographic flow, not an allocation designed to erase today’s shortage.
The future-demand side is not assumption-free. A household projection still has to decide whether headship rates stay constant or change, and immigration assumptions can move the growth number by millions of units nationally.
Does a cost-burdened household need a new unit?
A household paying 30% or more of their income on rent faces an affordability problem, but they already occupy a unit. Does fixing that problem require building a new home, or making an existing one affordable? Methodologies are split.
- Massachusetts and Colorado exclude cost burden from the unit target, treating it as a subsidy problem rather than a construction problem.
- In Washington, HB 1220 adds units to address baseline renter cost burden, phasing in a share of the backlog each year.
- California includes cost burden, but it adds the cost-burden adjustment after subtracting existing occupied stock, which makes the adjustment much smaller than applying it to the full household base.
- Oregon uses cost burden as an income-allocation key, not as a source of unit counts.
Cost burdened households can be a direct addition to need, a reason to target deeper affordability, a heavily discounted adjustment, or not count at all.
Do you credit the homes freed up by turnover?
When people downsize, pass away, or move out of a region, they release units back to the market. A method that only considers gross housing needs ignores those releases, whereas an estimate for net housing need subtracts them. Whether you count the homes that empty out is worth tens of thousands of units in a large region.
Massachusetts is the major allocation model that explicitly nets generational turnover, especially the wave of Baby Boomer and Silent Generation households dissolving and freeing homes over the horizon. While estimating units freed up by deaths can be straightforward, modeling other household moves to identify aggregate trends for which types of units are “freed up” or available to other households is a highly technical modeling exercise that is difficult to validate.
What counts as normal household formation?
“Suppressed” or “missing” households are people who would form their own household in a healthier market but instead remain doubled up, living with family, or otherwise not appearing as a separate household. Estimating them requires a baseline headship rate (which is itself a methodological assumption), and setting the baseline rate based on a previous “normal” year.
Oregon and Massachusetts anchor to year-2000 headship rates, before the long post-2000 decline. California’s Department of Finance avoids recession-depressed 2010 rates by reverting headship to the average of 2000 and 2010. Changing the baseline year will significantly grow or shrink the missing-households component based on the chosen reference point.
What vacancy rate is healthy?
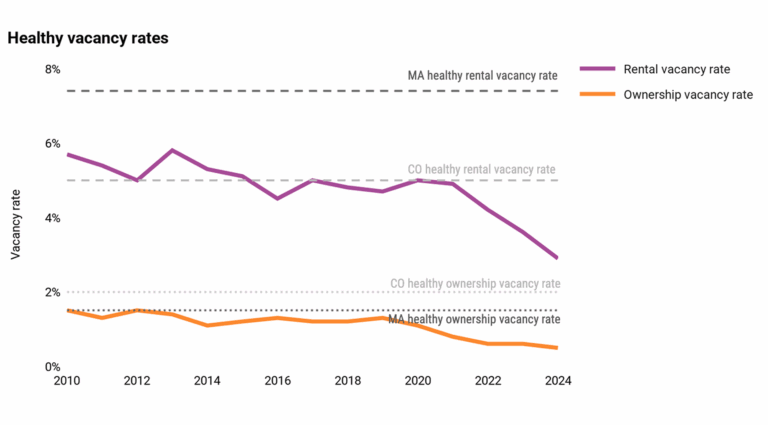
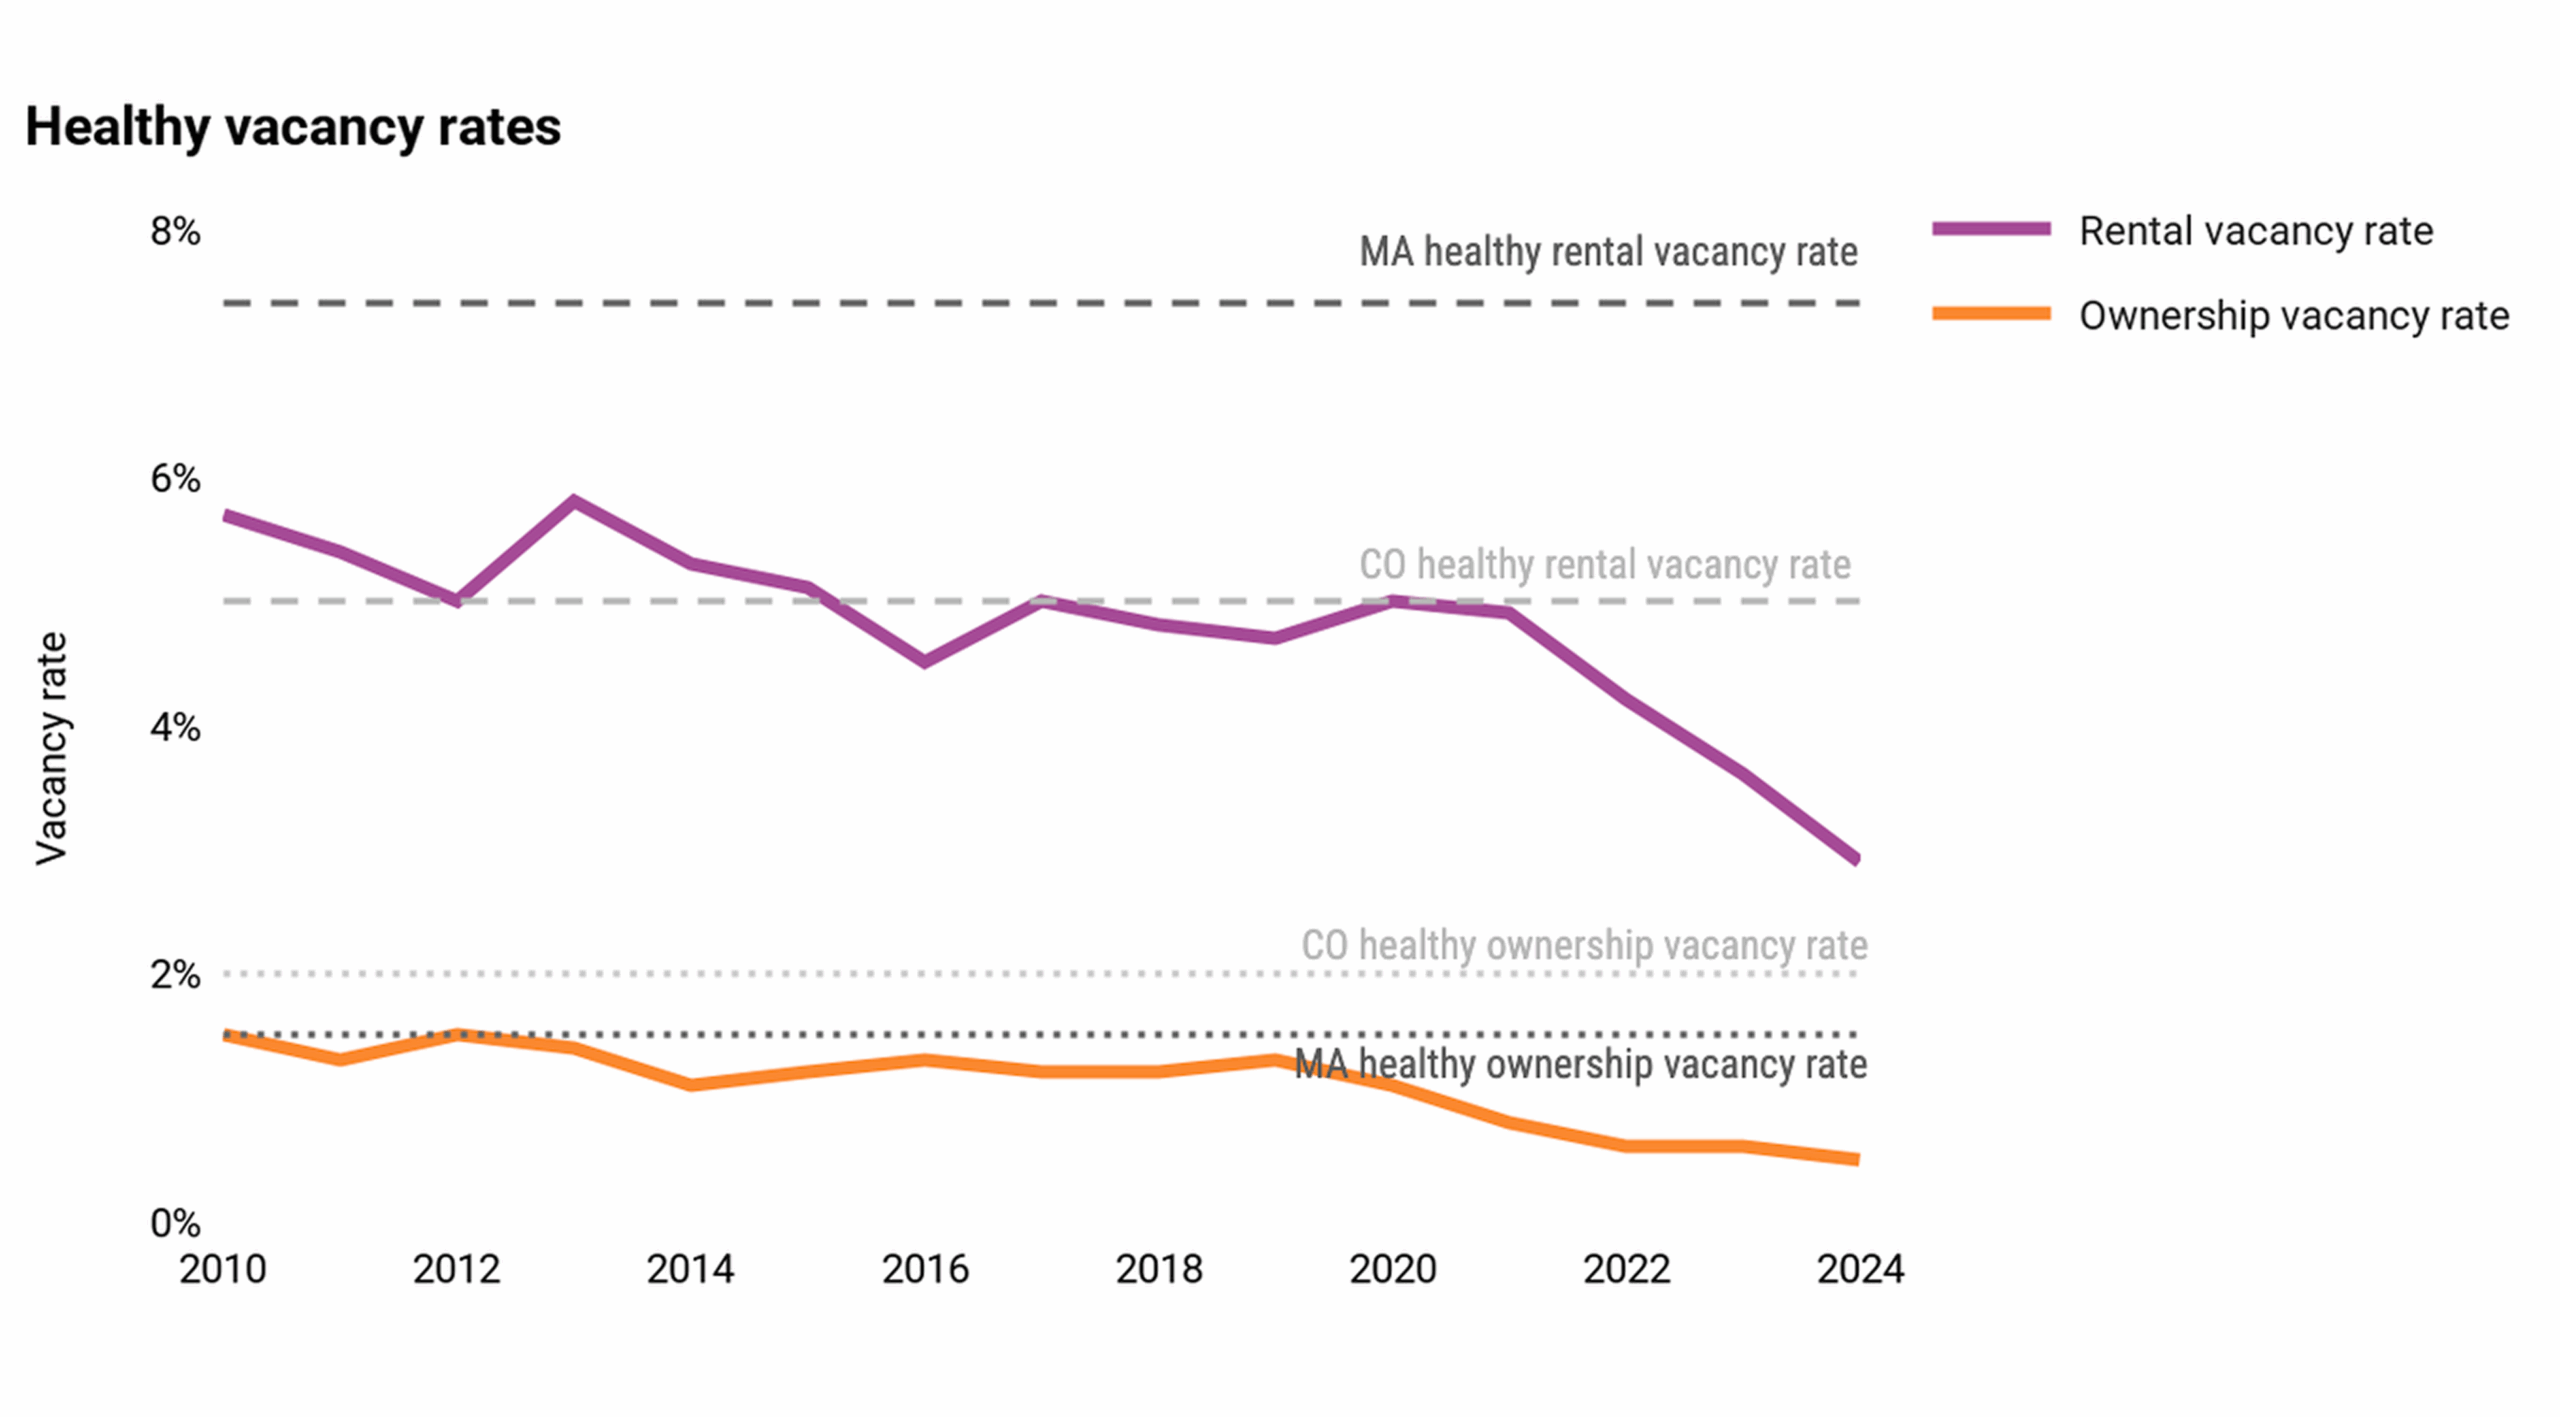
Every need model has to decide how much empty housing a functioning market needs. Low vacancy rates mean households cannot move, units cannot turn over smoothly, and prices rise faster, but the benchmark for a “healthy” rate varies. Similarly, as our housing stock ages, some units will be lost to disrepair and demolition; estimating the rate at which that happens differs regionally based on the unique age composition of housing stock. A healthy vacancy target of 5% versus 7.4% changes the estimated “need” by thousands of units solely because of the benchmark chosen.
This chart compares the actual vacancy rate data for Portland, Maine against the healthy vacancy benchmarks for Massachusetts and Colorado. These different benchmarks can result in very different calculations of unmet demand.

How are overlapping problems counted?
A household can be cost-burdened and overcrowded and living in a substandard unit. Simply adding those households would triple-count need. The cleaner public standards avoid double-counting issues in a few ways.
- HUD’s “most severe problem” hierarchy counts each household once, under its worst housing problem.
- California’s method subtracts existing occupied stock before adding the cost-burden term, reducing overlap between cost burden and other adjustments.
- Some local assessments report a mutually exclusive low estimate and an overlapping high estimate, letting the spread show the overlap.
- Others count each household once within its AMI band, then discount the supply side: some homes that are affordable at a given income level are already occupied by higher-income households, so they aren’t actually available (a “leakage” adjustment).
So what’s the actual need for my community?
Ultimately, there isn’t one answer. Estimates reflect how an agency or researcher thinks a “healthy” housing market functions and how it operates across different places and population segments. The practical takeaway for anyone reading a housing-need estimate is to understand the assumptions before reading the result, and be suspicious of any single headline figure presented without them. Two analysts can study the same region, follow defensible methods, and land 2-3x apart entirely on these choices. An honest estimate clearly states its assumptions and helps readers understand how those assumptions influence the final result.
References
Research benchmarks
- Harvard Joint Center for Housing Studies — Household and New Housing Unit Demand Projections for 2025–2035 and 2035–2045 (McCue, 2024). https://www.jchs.harvard.edu/sites/default/files/research/files/harvard_jchs_household_projections_mccue_2024_0.pdf
- National Low Income Housing Coalition — The Gap: A Shortage of Affordable Homes (2025). https://nlihc.org/sites/default/files/gap/2025/gap-report_2025_english.pdf
- Up for Growth — Housing Underproduction in the U.S. (annual; 2024 edition). https://upforgrowth.org/apply-the-vision/housing-underproduction-reports/
- Patel, Rajan & Tomeh — “Make it count: Measuring our housing supply shortage,” Brookings (Nov. 2024). https://www.brookings.edu/articles/make-it-count-measuring-our-housing-supply-shortage/
State & regional allocation programs
- California RHNA — Housing Element Law, Gov. Code §65584.01: https://leginfo.legislature.ca.gov/faces/codes_displaySection.xhtml?sectionNum=65584.01&lawCode=GOV · HCD statutory determinations: https://www.hcd.ca.gov/planning-and-community-development/statutory-determinations · UC Davis RHNA audit (2021): https://law.ucdavis.edu/sites/g/files/dgvnsk10866/files/inline-files/RHNA-Audit-Background-Paper-2021.01.04.pdf
- Oregon OHNA — Methodology Report (2024): https://www.oregon.gov/das/oea/Documents/OHNA-Methodology-Report-2024.pdf · ECONorthwest implementation methodology: https://econw.com/project/methodology-and-recommendations-for-implementation-of-the-oregon-housing-needs-analysis-2019-2023/
- New Jersey Mount Laurel (Fourth Round) — DCA calculation methodology: https://www.nj.gov/dca/dlps/pdf/FourthRoundCalculation_Methodology.pdf · S-50 / P.L. 2024, c.2: https://pub.njleg.gov/Bills/2024/S0500/50_I1.HTM
- Washington HB 1220 — RCW 36.70A.070: https://app.leg.wa.gov/RCW/default.aspx?cite=36.70A.070 · Commerce housing-planning guidance: https://www.commerce.wa.gov/growth-management/housing-planning/housing-guidance/
- Massachusetts — Chapter 40B: https://www.mass.gov/chapter-40b-planning-and-information · MBTA Communities §3A: https://www.mass.gov/info-details/multi-family-zoning-requirement-for-mbta-communities · “A Home for Everyone” / Future Housing Demand: https://www.mass.gov/future-housing-demand-in-massachusetts
- Connecticut §8-30g: https://www.cga.ct.gov/current/pub/chap_126a.htm
- Rhode Island Ch. 45-53: https://webserver.rilegislature.gov/Statutes/TITLE45/45-53/45-53-4.HTM
- Illinois AHPAA: https://www.ihda.org/about-ihda/ahpaa/
- Minnesota — Met Council affordable-housing need allocation: https://metrocouncil.org/Housing/Planning/Affordable-Housing-Measures/Allocation-of-Affordable-Housing-NEED.aspx
- Colorado — HB24-1313: http://leg.colorado.gov/bills/hb24-1313
- Utah — Moderate Income Housing, Utah Code 10-9a-403: https://le.utah.gov/xcode/Title10/Chapter9a/10-9a-S403.html
- New York — HCR Pro-Housing Communities (voluntary): https://hcr.ny.gov/phc · 2023 Housing Compact (mandatory targets, rejected): https://nysfocus.com/2023/04/18/hochul-housing-compact-dead-assembly-budget/
- Florida — Live Local Act: https://flhousing.org/live-local-act/
- Arizona — SB 1162 (2024), municipal housing-needs assessment: https://legiscan.com/AZ/text/SB1162/id/2988740
- District of Columbia — “36,000 by 2025” housing production goal: https://open.dc.gov/36000by2025/
Federal
- HUD Consolidated Plan / CHAS — 24 CFR Part 91: https://www.ecfr.gov/current/title-24/subtitle-A/part-91 · CHAS datasets: https://www.huduser.gov/portal/datasets/cp.html